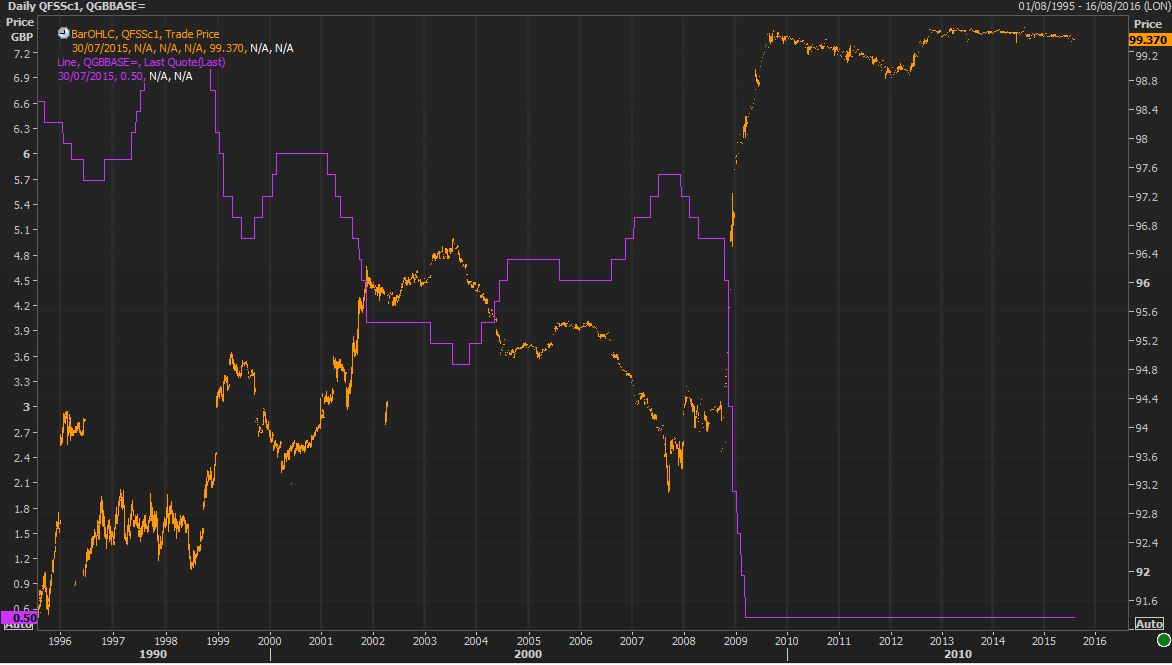
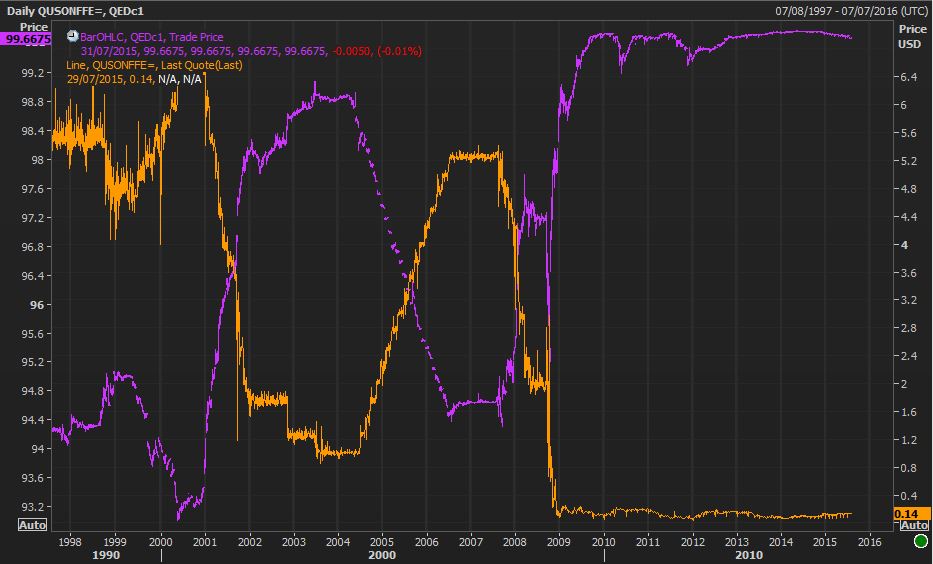
In the G3 80% of base rate changes are in the same direction as the previous change.
Tapering talk and improved G3 economics leads to one inexorable conclusion: We are probably in the endgame of historically low rates and the consequence of improved economic output and cutbacks in US asset purchase programs should result in steepening yield curves and a general increase in rates.
Although it is unlikely that there will be base rate changes for some time, STIR futures are largely about expectations and the prospect of some eventual central bank action prompted me to revisit an old study from UBS written by Antony Morris called Using trend strategies to benefit from gradualism in monetary policy, October 2006.
This study put forward an interesting hypothesis that central banks create trends in short-term rates and often STIR markets do not price in these trends. Indeed, the table below shows that over a significant period of time, one central bank rates change is followed by one in the same direction.

You can’t get much better than that for a long term trending market, something in scarce supply for systematic traders in recent years. Indeed, the trends are actually enforced by the very nature of central banks when compared to other markets like equity.
- Central bankers face few restrictions on timing or tone of their comments on policy compared to that of equity corporate insiders who face considerable restrictions.
- Central Bankers can decide exactly when to make changes at the short end of the curve whereas corporate equity insiders cannot completely control earnings reports
- Central Bankers exercise significant control over the market at the short end,whereas equity corporate insiders cannot control reaction to new new information.
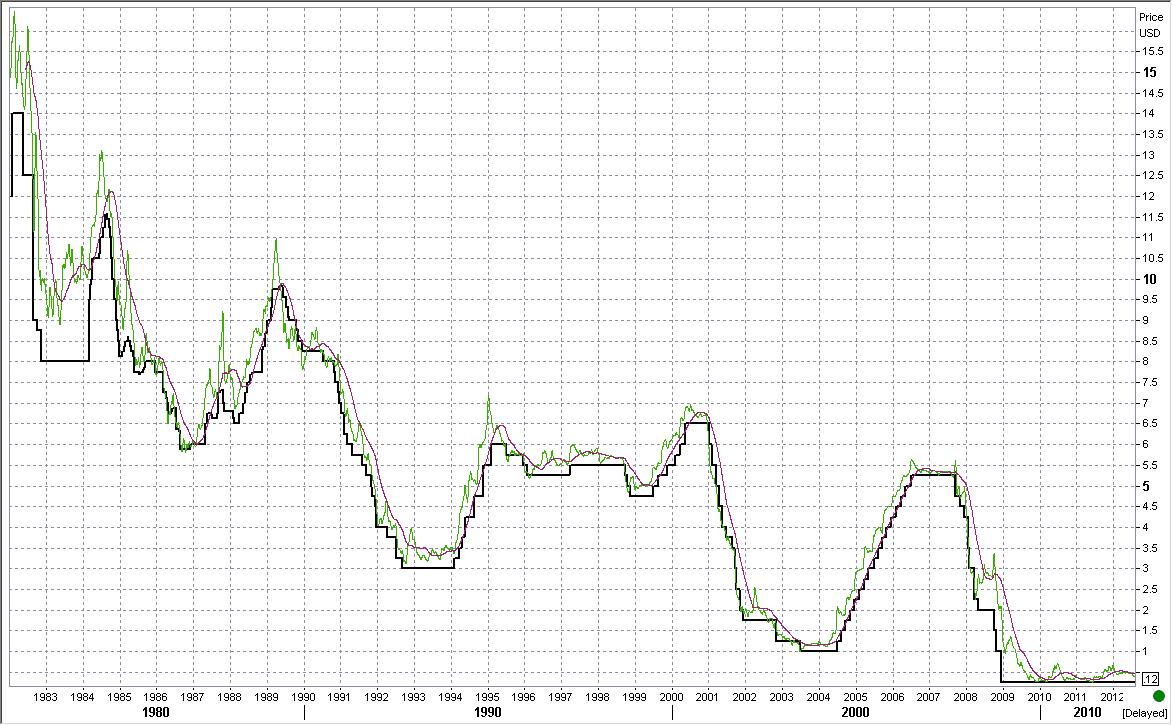
The charts below show these effects. First is the ECB MRO and second Fed Funds both with 9 day and 124 moving averages highlighting the stable long term trends evident in rate cycles.

ECB MRO (black), Euribor front month STIR future 9 day MA (green) Euribor front month STIR future 124 day MA (purple)

Fed Funds (black), Eurodollar front month STIR future 9 day MA (green) Eurodollar front month STIR future 124 day MA (purple) Both charts from Reuters Eikon.


