A strip of Euribor futures are derivatives on sequential forward starting inter-bank offered rates. As would be expected, each Euribor future is highly and consistently correlated with its adjacent contracts. For example, a Z0 future (expiring in December 2020) might be ≈98% correlated with the H1 (March 2021) contract.
This stable relationship between adjacent contracts make spread trading in the form of calendar spreads (future1 -future2) or butterfly’s (future1- 2x future2-future3) very popular as a low volatility trading strategy albeit often requiring high leverage in order to generate enough return.
It is difficult to imagine how Euribor futures could ever become negatively correlated to each other but as is often with risk, reality can be stranger than theory. This happened once in my trading lifetime in 1999 due to a phenomenon subsequently called the millennium fly. This was when the Z0 (December 2000) futures sold off sharply (implied forward rates increased since stir futures are quoted on a 100-r basis) whilst the adjacent U9 (Sept 1999) and H1 (March 2001) contracts continued a upward trend (implied forward rates decreased) in line with other interest rate related product. This effect was later attributed to a US bank allegedly being refused access to funding markets in the new millennium for being deemed to be non-Y2K compliant.
This effect of Euribor futures becoming negatively correlated has happened again for the first time in 20 years (to my knowledge). During the 2019, up until 24th July, the Z0H1 (December 2020-March 2021) spread traded in a range of 0.02 to 0.07 with an average daily spread volume of ≈4000.
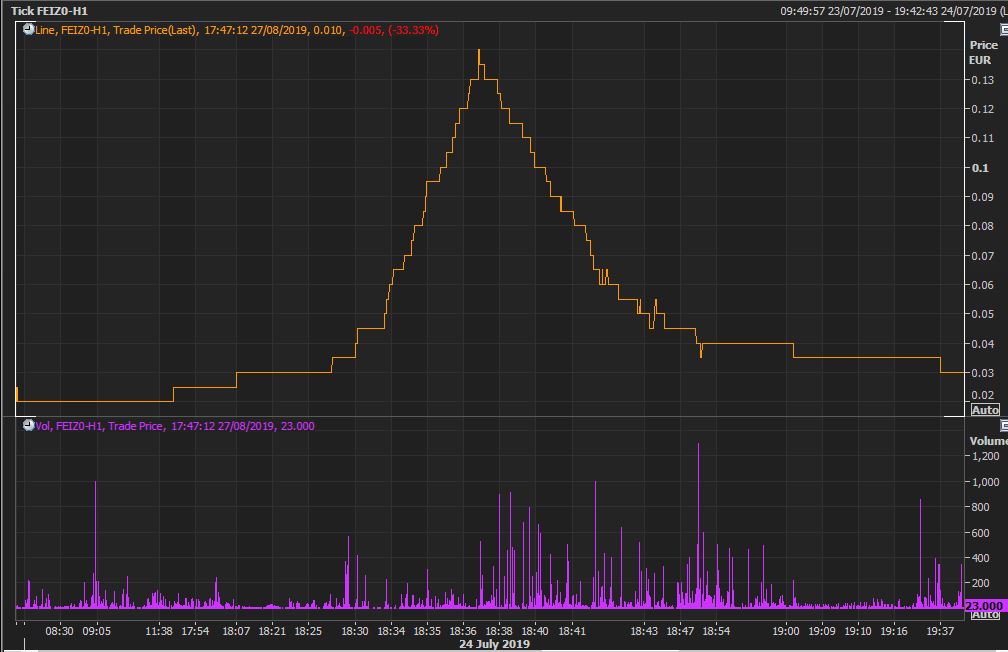
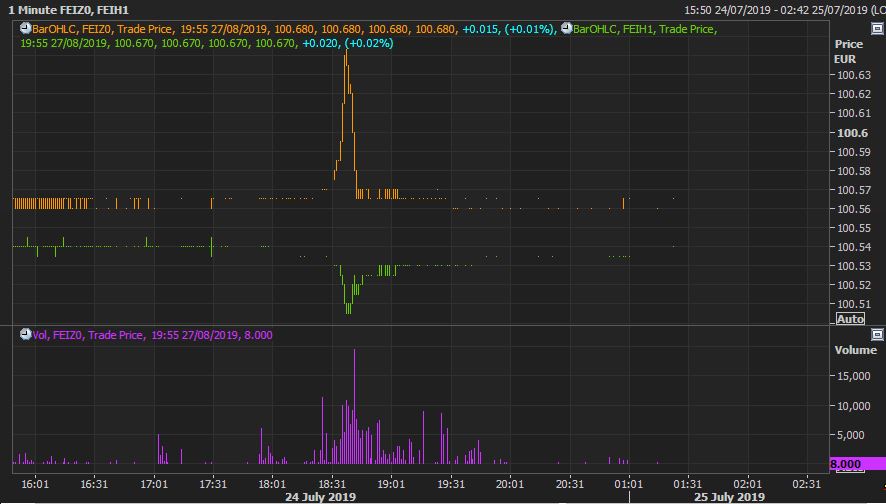
During normal trading hours on 24th July, the Z0H1 spread had traded between 0.02 and 0.03, but from 17:25 hrs to 17:37 hrs on the same day, blew out to 0.14 and then traded back down to 0.03 by 18:37pm on a volume of over 90,000 contracts. This was driven by aggressive buying of ≈60,000 Z0 contracts from a price of 100.565 to 100.640 whilst the H0 sold off from 100.535 to 100.510 on volume of ≈28,000 during the same time period (17:25 hrs to 17:37 hrs).
The charts below graphically display the moves in the both the spread and the individual futures contracts, highlighting the temporary enforced negative correlation between Z0 and H1. Charts by Reuters Eikon.


24/07/19 1 min data, Price and volume (Z0 bottom)
This was probably a very expensive 12 minutes from the perspective of proprietary traders and the instigator of the trade. The adverse mark-to-market on leveraged short Z0H1 positions might have led to proprietary traders buying back short spreads to reduce inventory but thereby exacerbating the move. Whoever or whatever was behind the trade would have ultimately lost money since the spread and the individual component futures contracts subsequently normalised back to levels seen earlier in the day. Given that none of the trades violated the Exchange’s tolerances and circuit breakers, all trades stood, and none were cancelled.
The move defies logic. The next day (25th) was an ECB policy meeting day but rates were unchanged and there was no market moving news regarding QE policy. The move was measured in minutes, not milli-seconds, perhaps ruling out a fat finger or flash crash. Someone might have a very specific idea regarding European rates in Q120, but it was awful trade execution to achieve it. Market manipulation? Isn’t the idea the make money from that. This trade would have lost the instigator money. Focus will probably fall on an algorithmic error, but the reality is that we will probably never know for sure. Maybe it’s a sign of age but when things like this happen, I’m glad that I’m no longer in the game!
